Finding Leakage Beyond Predefined Controls: Anomaly Detection on a Data Lakehouse
Every control on the dashboard exists because someone, at some point, found that specific leak the hard way and built a check so it wouldn’t happen again. The system is a museum of past failures. It’s excellent at preventing reruns and blind to anything genuinely new.
This post is about the other half of the job, finding the leakage nobody has written a control for yet and how a data lakehouse makes that practical rather than aspirational. I’ll be concrete about what it is, what it actually catches, where it works, and, just as importantly, where it doesn’t.
Two different questions
Start with the distinction that matters, because everything follows from it.
Rule-based revenue assurance asks a closed question: is this known thing wrong? Are CDRs missing between mediation and billing? Does the rated amount match the tariff? Is this partner’s declared volume within tolerance of ours? Each control encodes a specific failure mode someone already understands, and checks for it. When the answer comes back “yes, it’s wrong,” you act.
Anomaly detection asks an open question: what in this data is behaving unlike it should — whether or not we predicted it? It doesn’t need the failure mode specified in advance. It learns what normal looks like from the data itself, then surfaces what departs from normal. You’re not telling it what to find. You’re telling it to tell you what doesn’t fit.
That difference is not academic. The closed question can only ever cover the failures you’ve already imagined. The open question covers the ones you haven’t — which, if you believe the RA manager’s joke, is where the money you’re still losing actually is.
Why rules keep missing things
It’s worth being precise about why a rule-based system has a ceiling, because the reason isn’t laziness or under-investment. It’s structural.
A rule is a snapshot of a known risk at the moment someone built it. The network it watches, though, doesn’t hold still. A new prepaid bundle launches with a promotional rate and an edge case in how it’s charged. An interconnect agreement adds a new partner with a different settlement rule. A VAS provider changes how it reports usage. A system migration subtly alters how one product’s events get written. Each of these is a new surface for revenue to escape through, and each one postdates the control set that’s supposed to catch leakage.
So there’s a permanent lag between the network as it is and the controls as they were written. The rules cover last year’s known failure modes. This year’s failure modes are, by definition, not yet known and a rule-based system cannot see a failure mode nobody has described to it. It stays invisible until it grows large enough to surface somewhere indirect: an unexplained dip in margin, a partner dispute, an auditor’s sampling that happens to land on it. By then it’s been leaking for months and the money is unrecoverable.
You cannot write a control for an unknown unknown. If you knew the specific mechanism, you’d already have the check. That’s the trap, and adding more rules doesn’t spring it — every new rule is still just one more known-failure check, and the space of unknown failures is larger and keeps growing.
What this looks like built on a lakehouse
Here’s the architecture, and then a worked example, because the concept only becomes real when you can follow it end to end.
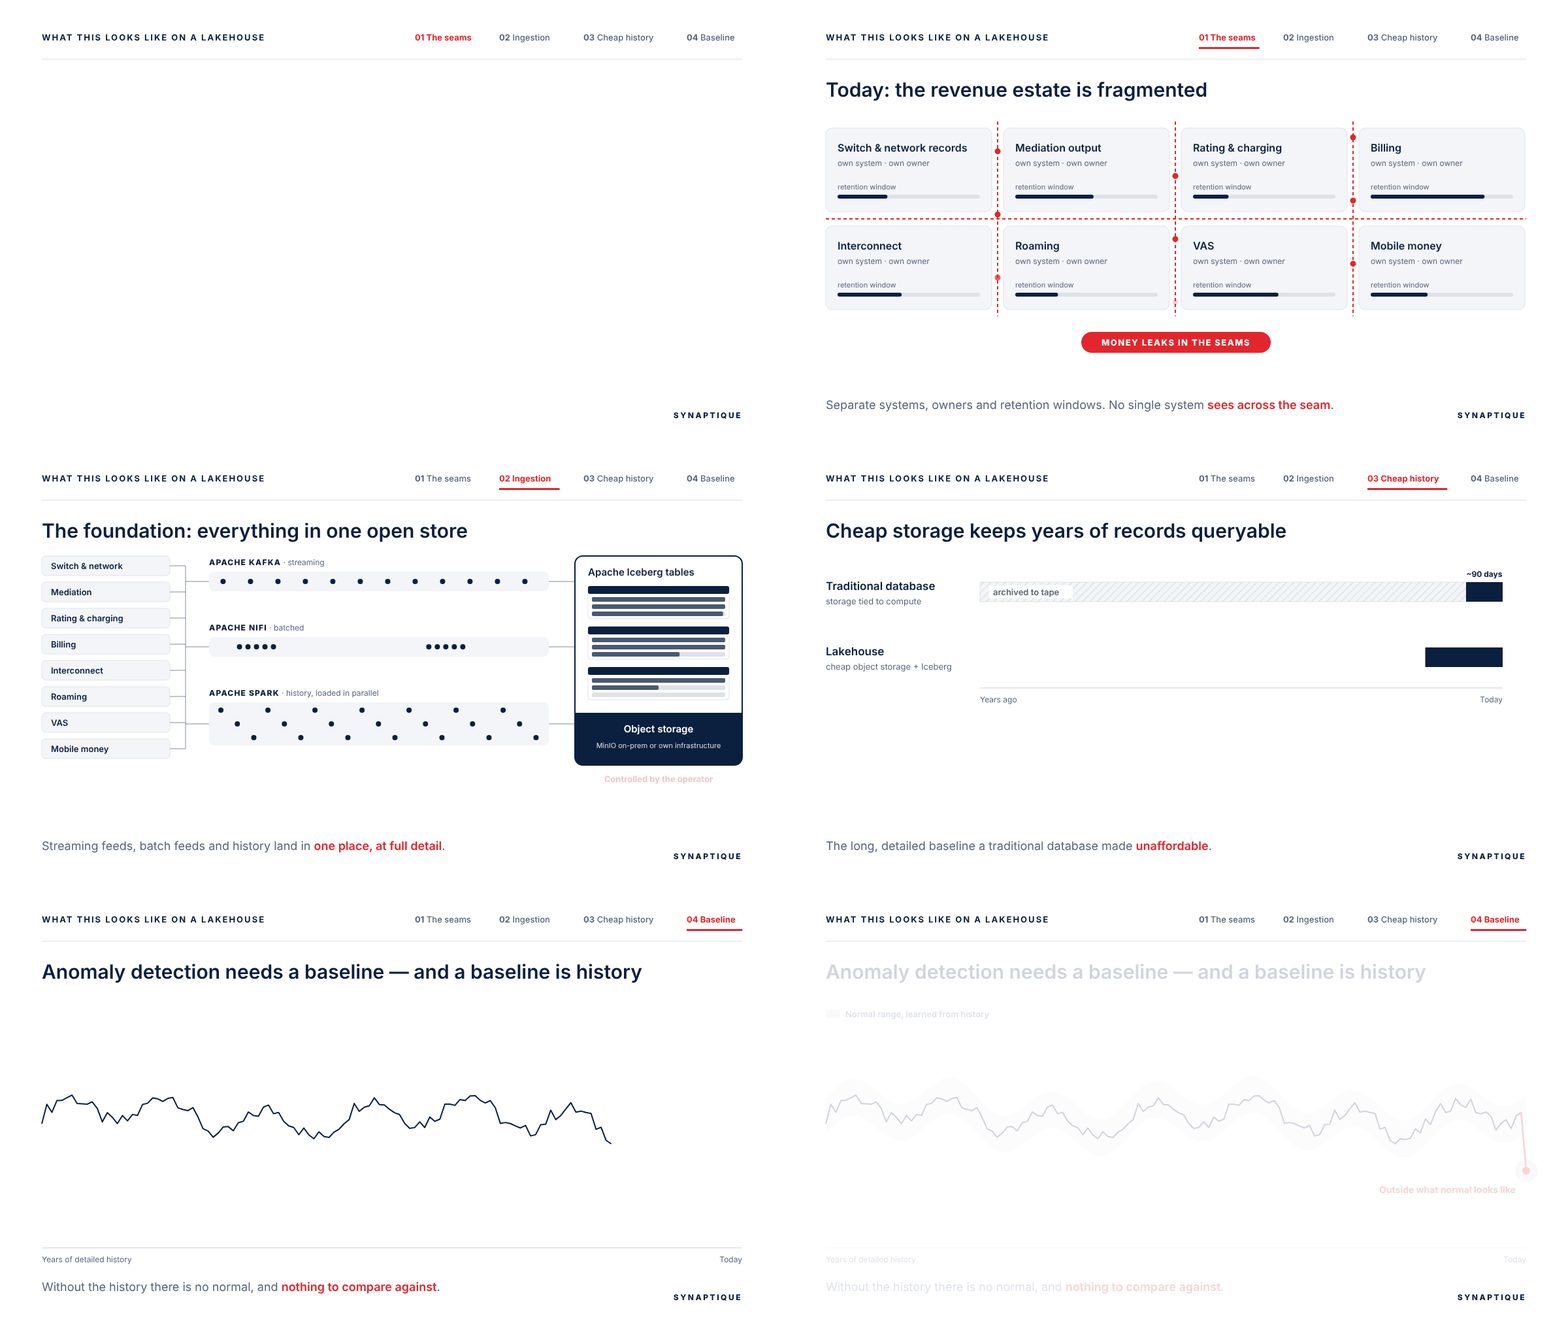
The foundation: everything in one place, with history
Anomaly detection is comparison against a baseline, and a baseline is history. So the first requirement is unglamorous and non-negotiable: the data that touches revenue, in one place, at full detail, with enough history to establish what normal is.
For an operator that means the whole revenue-relevant estate landing in one open store switch and network records, mediation output, rating and charging, billing, and the partner-facing feeds: interconnect, roaming, VAS, mobile money. In most operators these sit in separate systems with separate owners and separate retention windows, and that fragmentation is itself part of why leakage hides. Money leaks in the seams between systems precisely because no single system can see across the seam.
On the Synaptique platform this is the ingestion and storage layer. Apache Kafka and Apache NiFi bring the feeds in, streaming and batched; Apache Spark loads history in parallel into Apache Iceberg tables sitting on object storage the operator controls — MinIO on-premise, or the client’s own infrastructure. The reason this matters for anomaly detection specifically is economic: because storage is cheap object storage and is separated from compute, you can afford to keep years of detailed records queryable rather than archiving them to tape after ninety days. A long, detailed baseline is the thing a traditional database made unaffordable, and it’s the thing anomaly detection depends on most.
The method: learn normal, surface the departures
Once the data is together and historical, the technique is to model what normal looks like (for each stream on its own, and for the relationships between streams) and then flag what deviates, scored by how far from normal it sits.
“Normal” is more subtle than an average. It’s normal for this route, on this day of the week, at this time, for this product, for this partner. Interconnect traffic on a particular international route has a shape: a weekday profile, a weekend profile, a seasonal drift. Revenue-per-minute on a tariff has an expected range. The ratio between usage events a product generates and charging records it produces has a baseline. Anomaly detection learns those shapes and tells you when today stops matching them, without anyone having written a rule that says “watch this ratio.”
A worked example
Let me make it concrete with the kind of case that actually surfaces, built from the real shape of this problem rather than a specific client.
An operator launches a new data bundle aimed at a youth segment, a low flat rate for a generous allowance, with a promotional carve-out for a few zero-rated apps. Commercially it’s a success; uptake is strong. Every existing RA control stays green, because every control was written for the products that existed before this one. Billing produces records. Mediation isn’t dropping anything. The tariff that’s configured matches a tariff that was approved.
But there’s an edge case. The zero-rating logic, under a particular sequence of app usage, is also zero-rating a slice of general traffic it was never meant to. Each individual instance is tiny, a few megabytes, well below any threshold anyone would set. There’s no rule for it because nobody imagined this specific interaction when they built the control set. On the dashboard, nothing is wrong.
What anomaly detection sees is different. The revenue-per-gigabyte on that bundle’s traffic sits measurably below the baseline for comparable data traffic, and the gap widens as the bundle scales. It can’t tell you why, it doesn’t know about the zero-rating edge case. But it can tell you that: this product’s revenue-per-unit is behaving unlike anything comparable, the deviation is growing, and here are the records that make it up. That’s enough to send an investigator to exactly the right place, months before the margin report would have raised a vaguer, later alarm.
That’s the pattern, and the point: a deviation from an established baseline, found with no pre-written rule for that specific failure, pointed at precisely enough to investigate.
Other shapes it catches
The zero-rating case is one kind. A few others that recur, each invisible to rules and visible to a baseline:
A partner feed whose reported volume drifts away from the corresponding network records over several weeks, never far enough in any single week to trip a tolerance, but clearly diverging once the trend is set against the baseline. Slow leaks evade thresholds by design; they don’t evade trend comparison.
A product that, after a system change, begins producing usage events with no matching charging record for a small fraction of sessions. Individually each missing record is nothing. As a shift in that product’s usage-to-charging ratio, it stands out.
Interconnect on a route where the traffic profile quietly changes shape, the same total volume, but redistributed in a way that suggests reclassification or re-routing. The total looks fine to a volume check. The shape looks wrong to a baseline.
Why the lakehouse specifically, and not just “analytics”
It’s fair to ask whether this needs a lakehouse at all, or whether it’s just “do analytics on your RA data.” Two properties make it architecture-dependent rather than tool-dependent.
The first is cheap, long history. Because the lakehouse separates storage from compute and keeps records in inexpensive open storage, a multi-year baseline is affordable. On a traditional coupled-cost database, keeping that depth of detail online is expensive enough that most operators don’t , and a short baseline is a weak baseline. Anomaly detection with three months of history can’t tell you that this month is abnormal relative to last year’s same month.
The second is cross-stream queryability. The most valuable anomalies are the cross-domain ones: usage that doesn’t match charging, partner volumes that don’t match network records, revenue-per-unit that doesn’t match a comparable product. Those comparisons are only possible if the datasets are queryable together. Siloed in separate systems, the single most important class of leakage (the kind that leaks in the seams) stays structurally invisible. One open store, queried across, is what makes it visible at all.
What it does not do
I’d rather state the limits plainly than have an RA team discover them and distrust the whole thing, because this audience has been promised “AI finds all your leakage” before, and rightly didn’t believe it.
Anomaly detection produces candidates, not verdicts. It tells you where the data stopped behaving as expected. It does not tell you that the deviation is definitely leakage, and it does not tell you the cause. A spike can be a real commercial event, a genuine surge in legitimate traffic, a promotion working better than forecast. Every anomaly still needs a human to investigate and classify. What the system changes is where that human looks: at places a rule would never have sent them, months earlier than a lagging indicator would have.
It does not replace rule-based RA. Your existing controls are efficient and precise at the known failure modes, keep them running. Anomaly detection sits on top, covering the space the rules can’t reach. Rules for what you know; anomaly detection for what you don’t. The two together are the actual recommendation, not one instead of the other.
And it is only as trustworthy as the data underneath it. If a feed is incomplete before it reaches the store (mediation silently dropping records, a source system under-reporting) then the baseline itself is built on a distorted picture, and the system will confidently flag anomalies against a wrong normal, or miss them against one. Instrumenting data quality at ingestion comes first. A lakehouse will faithfully store a complete and confident version of an incomplete reality if you let it.
Where to start
Not with a platform rollout, and not with a committee. The honest first move is small and specific: pick one revenue domain where you suspect leakage you can’t pin down (interconnect is a common one, or a product family with complicated charging) and run anomaly detection against its history, on your own records, for that domain only.
It’s bounded, it uses data you already have, and it ends on something concrete: here are the deviations your existing controls never flagged, here are the records behind them, here is what’s worth investigating first. What comes back is usually not what anyone predicted, which is the entire reason it’s worth doing, and the clearest proof that the rule set had a ceiling.
Synaptique runs exactly this as a scoped engagement: one domain, your data, the anomalies your current rules don’t catch, quantified and handed to your team to investigate. It’s the cheapest way to find out whether the leakage you can’t see is small enough to ignore, or large enough that you’ll wish you’d looked sooner.
If you want to scope one, that’s the conversation to have. Book a call with our team now